Your company’s data is more than just numbers on a spreadsheet.
It’s the fuel that can power your next viral marketing campaign, drive engagement, and ultimately, boost your bottom line.
But turning it into something that resonates with your audience?
That’s the million-dollar question.
Let’s face it:
Capturing and holding your audience’s interest is harder than ever.
But what if I told you that the key to creating viral content is already at your fingertips?
In this guide, we’ll walk through a 5-step blueprint that will help you unlock the viral potential of your company’s data.
So how do you transform those dry, seemingly uninspiring figures into content that people can’t wait to share?
Let’s dive in.
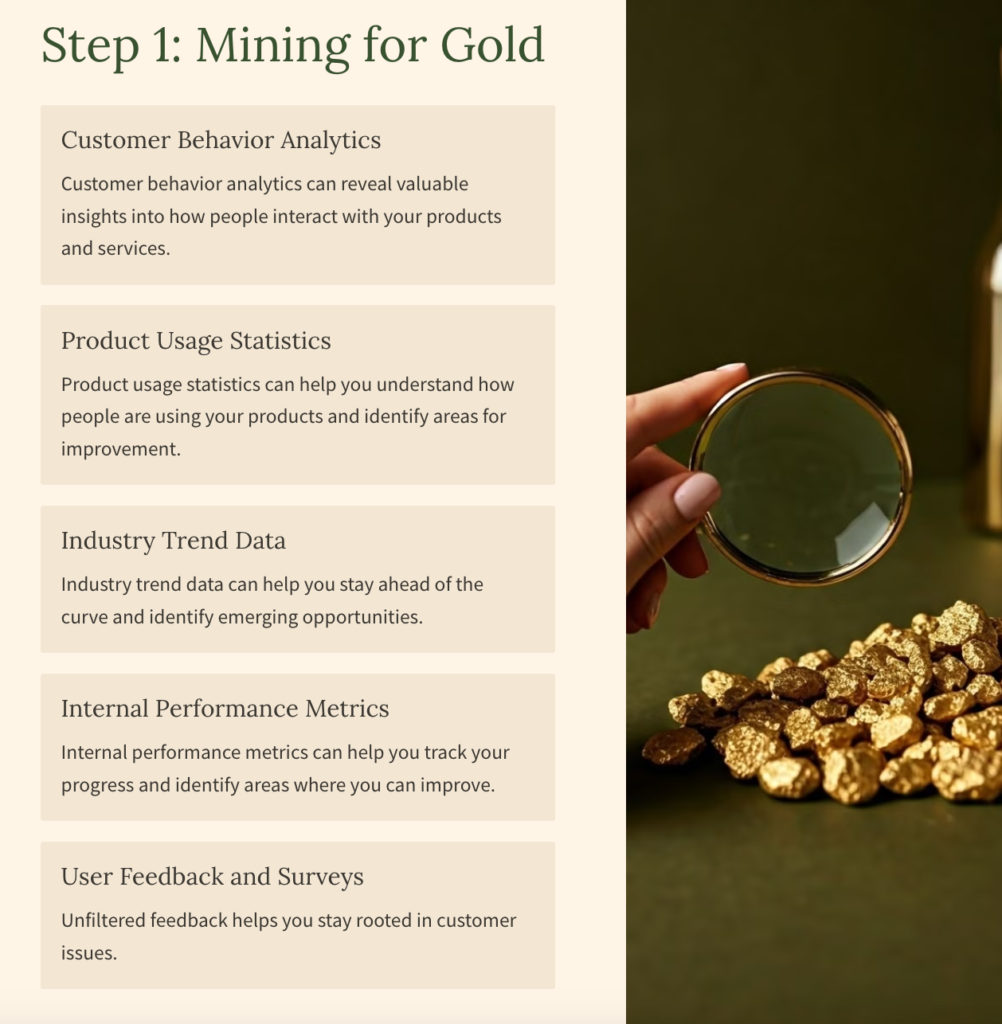
Step 1: Mining for Gold – Identifying Your Most Compelling Data Points
Before we can create viral content, we need to find the nuggets of information that will resonate with our audience.
But how do you separate the wheat from the chaff?
The Data Audit
Start by conducting a comprehensive audit of your company’s data. This isn’t just about looking at your latest quarterly report.
Think broader::
1 – Customer behavior analytics
2 – Product usage statistics
3 – Industry trend data
4 – Internal performance metrics
5 – User feedback and surveys
Remember, not all data is created equal. You’re looking for information that is:
- Surprising: Does it challenge common assumptions?
- Relatable: Can your audience see themselves in the data?
- Actionable: Does it provide insights people can use?
- Timely: Is it relevant to current trends or events?
The “So What?” Test
For each data point you’re considering, ask yourself:
“So what?”
If you can’t immediately articulate why someone outside your company would care about this information, it might not be the golden nugget you’re looking for.
Contextualizing Your Data
Raw numbers rarely tell the whole story. Look for ways to contextualize your data to make it more impactful.
For example:
- “Our app saves users an average of 2 hours per week” becomes more powerful when framed as “Our app gives you back 104 hours a year – that’s like adding an extra 4 days to your year!”
By the end of this step, you should have a shortlist of compelling data points that have the potential to capture people’s attention and imagination.
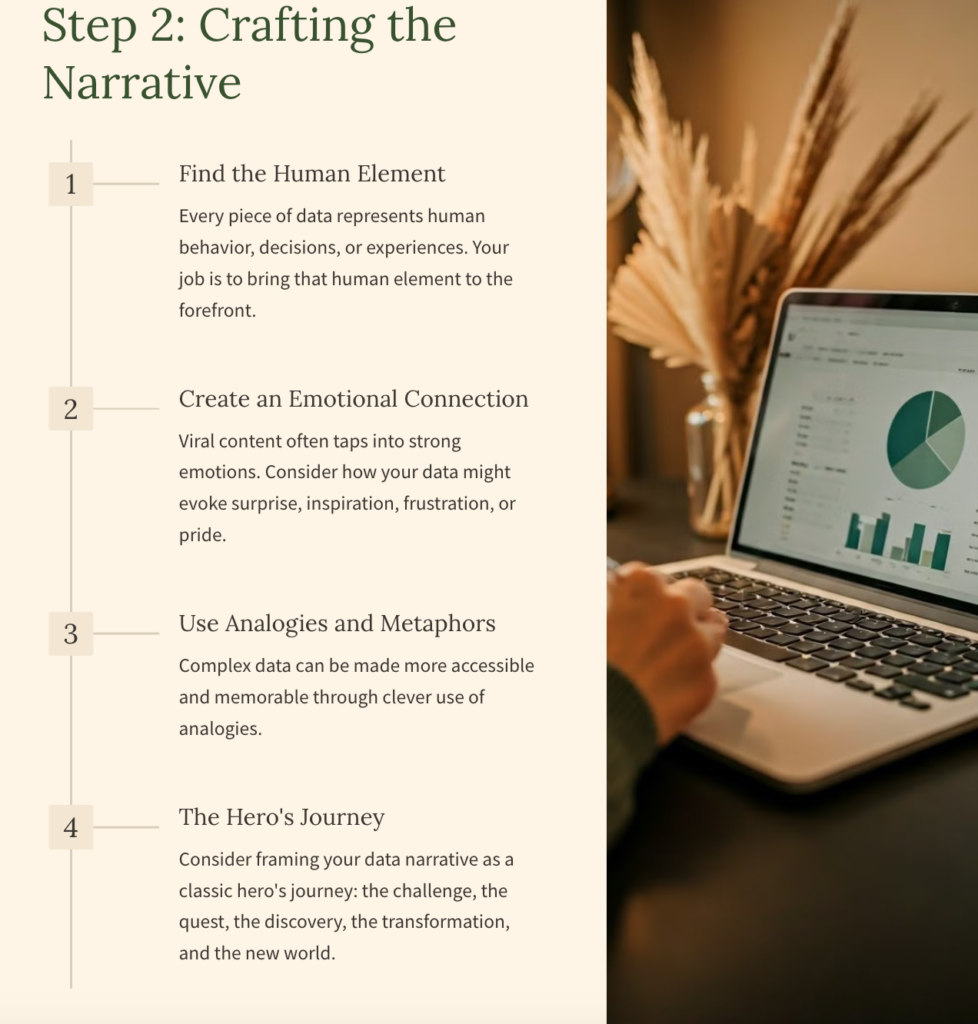
Step 2: Crafting the Narrative – Turning Numbers into Stories
Now that you’ve identified your most promising data points, it’s time to weave them into a narrative that will resonate with your audience.
People don’t share data – they share stories.
Find the Human Element
Every piece of data represents human behavior, decisions, or experiences. Your job is to bring that human element to the forefront.
Ask yourself:
- Who are the people behind these numbers?
- What challenges or aspirations do these figures represent?
- How does this data reflect broader trends in society or industry?
Create an Emotional Connection
Viral content often taps into strong emotions. Consider how your data might evoke:
- Surprise: “I had no idea that was possible!”
- Inspiration: “If they can do it, so can I!”
- Frustration: “This needs to change!”
- Pride: “Look how far we’ve come!”
Use Analogies and Metaphors
Complex data can be made more accessible and memorable through clever use of analogies. For instance:
- “Our encryption algorithm is so secure, it would take all the computers on Earth working together 1 billion years to crack it. That’s like trying to find a specific grain of sand on all the beaches in the world – blindfolded!”
The Hero’s Journey
Consider framing your data narrative as a classic hero’s journey:
- The Challenge: What problem does your data highlight?
- The Quest: How did you gather or analyze this information?
- The Discovery: What surprising insights did you uncover?
- The Transformation: How does this change the way we see things?
- The New World: What actions can people take based on this new knowledge?
By the end of this step, you should have a compelling story that brings your data to life and gives it meaning beyond the numbers.
LISTEN TO OUR PODCAST
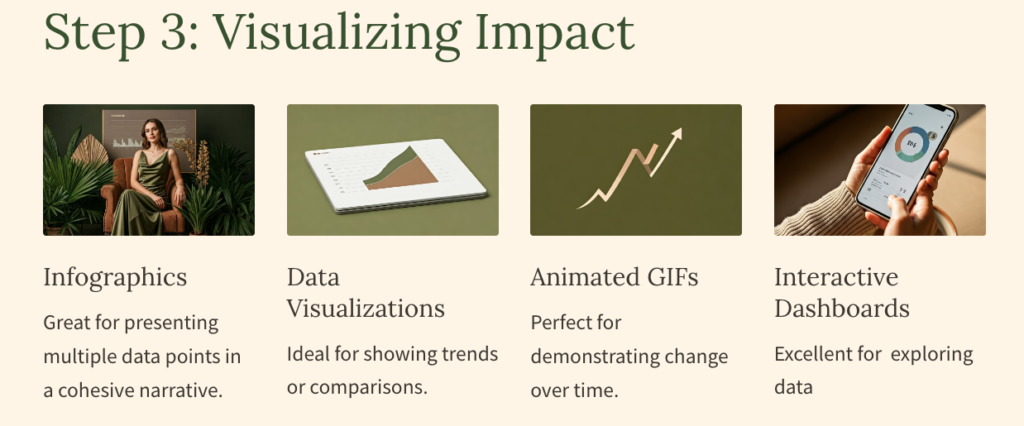
Step 3: Visualizing Impact – Designing Shareable Data Visuals
A picture isn’t just worth a thousand words – it’s worth a thousand shares.
This is where we transform your data and narrative into visually stunning, instantly shareable content.
Choose the Right Format
Different types of data lend themselves to different visual formats:
- Infographics: Great for presenting multiple data points in a cohesive narrative
- Data visualizations: Ideal for showing trends or comparisons
- Animated GIFs: Perfect for demonstrating change over time
- Interactive dashboards: Excellent for allowing users to explore data themselves
Keep it Simple
The key to viral data visuals is simplicity. Your audience should be able to grasp the main idea within seconds.
Some tips:
- Use a clear, attention-grabbing headline
- Limit your color palette to 2-3 main colors
- Focus on one main insight per visual
- Use icons and illustrations to make abstract concepts concrete
Make it Brand-Consistent
While your visuals need to stand out, they should also be immediately recognizable as coming from your company. Incorporate your brand colors, fonts, and style guidelines into your designs.
Optimize for Sharing
Your visuals need to work across multiple platforms:
- Create multiple sizes for different social media platforms
- Ensure text is readable even when the image is small
- Include your company logo or website URL (subtly)
The “Scroll-Stop” Factor
In a world of endless scrolling, your visual needs to make thumbs stop mid-swipe.
Consider:
- Using unexpected or contrasting colors
- Incorporating motion (for animated formats)
- Leading with a surprising statistic or question
By the end of this step, you should have a set of visually compelling, easily shareable assets that encapsulate your data story.
Step 4: Amplifying Reach – Strategically Deploying Your Content
Creating great content is only half the battle. Now it’s time to get it in front of the right eyes and start the viral spread.

Know Your Platforms
Different content works better on different platforms.
- LinkedIn: Ideal for B2B insights and professional development content
- Twitter: Great for bite-sized facts and real-time engagement
- Instagram: Perfect for visually striking infographics and data visualizations
- TikTok: Excellent for short, engaging data-driven videos
Timing is Everything
The best content in the world won’t go viral if it’s posted at the wrong time.
Research optimal posting times for your industry and platforms:
- Time zones of your target audience
- Industry events or news cycles you can piggyback on
- Seasonal trends that might make your content more relevant
Leverage Influencers and Partners
Identify influencers, thought leaders, and partner companies in your space who might be interested in your data story.
Reach out to them with a personalized pitch on why this content is relevant to their audience.
Engage, Don’t Just Broadcast
Social media is a two-way street. As you share your content:
- Respond to comments and questions promptly
- Encourage discussions around your data
- Ask for your audience’s thoughts and experiences
Use Paid Promotion Strategically
While organic reach is ideal, sometimes a little boost can help start the viral spread:
- Promoting posts to a highly targeted audience
- Using retargeting to reach people who have engaged with your content before
- A/B testing different headlines or visuals to see what resonates best
Create a Content Ecosystem
Don’t let your viral content exist in isolation. Create supporting content that dives deeper into different aspects of your data story:
- Blog posts exploring the implications of your findings
- Podcasts discussing the data with industry experts
- Webinars presenting more detailed analysis
By the end of this step, you should have a comprehensive strategy for getting your content in front of the right people and encouraging them to share it further.
Step 5: Measuring Success and Iterating – Turning Viral Hits into Long-Term Value
Going viral is exciting, but it’s not the end goal.
The real value comes from turning that momentary attention into lasting engagement and business results.
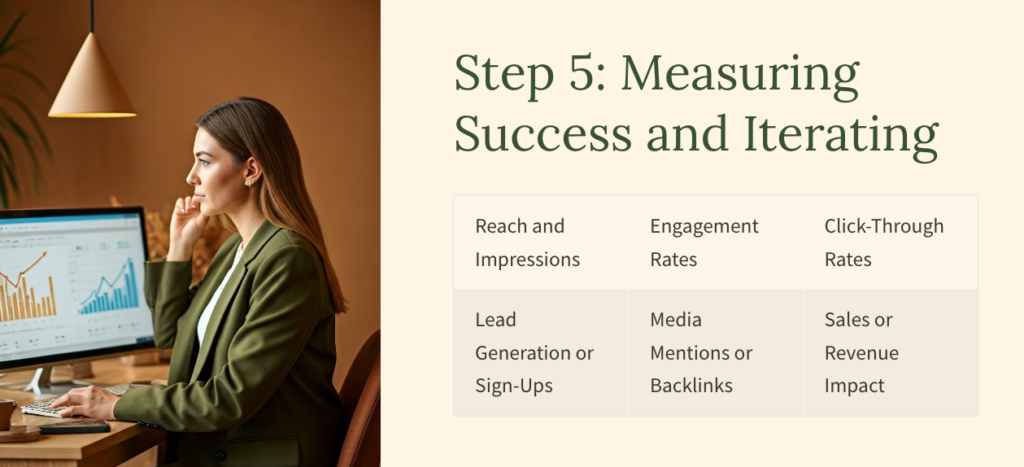
Define Your Metrics
Before you can measure success, you need to know what success looks like. Consider metrics like:
- Reach and impressions
- Engagement rates (likes, comments, shares)
- Click-through rates to your website
- Lead generation or sign-ups
- Media mentions or backlinks
- Sales or revenue impact
Track and Analyze
Use analytics tools to track the performance of your content across platforms.
Look for patterns:
- Which platforms drove the most engagement?
- What types of headlines or visuals performed best?
- Were there any unexpected audience segments that engaged strongly?
Capture the Momentum
A viral hit creates a window of opportunity. Be ready to capitalize on it:
- Have follow-up content ready to go
- Prepare your sales and customer service teams for increased interest
- Consider launching a timely promotion or offer
Learn and Iterate
Use the insights from your viral content to inform future strategies:
- What themes or topics resonated most with your audience?
- How can you repurpose or expand on your successful content?
- What new data points or stories emerged from audience engagement?
Build Long-Term Relationships
Viral content often attracts new audiences. Have a plan to nurture these new connections:
- Segment new followers or leads based on their entry point
- Create targeted nurture campaigns
- Offer valuable, relevant content to keep them engaged
Share Your Success Internally
Don’t forget to celebrate and share your success within your organization:
- Present results to leadership and other departments
- Use the success to advocate for more data-driven content initiatives
- Recognize team members who contributed to the viral campaign
By consistently applying this blueprint and learning from each iteration, you’ll be well on your way to transforming your company’s dry data into a powerful engine for viral content and business growth.
Conclusion: From Data to Virality – Your New Competitive Edge
In today’s digital landscape, the ability to turn raw data into viral content isn’t just a nice-to-have skill – it’s a crucial competitive advantage.
By following this 5-step blueprint, you’re not just creating shareable content; you’re positioning your tech company as an innovative thought leader, driving engagement, and ultimately, fueling growth.
The journey from spreadsheet to viral sensation isn’t always straightforward.
It requires creativity, strategic thinking, and a deep understanding of your audience. But with persistence and the right approach, you can unlock the hidden potential in your company’s data and create content that truly resonates.
So, are you ready to transform your data into your next viral hit?
The blueprint is in your hands – it’s time to put it into action.
Your audience is waiting to be amazed by the stories your data can tell. Let’s show them something they can’t help but share.
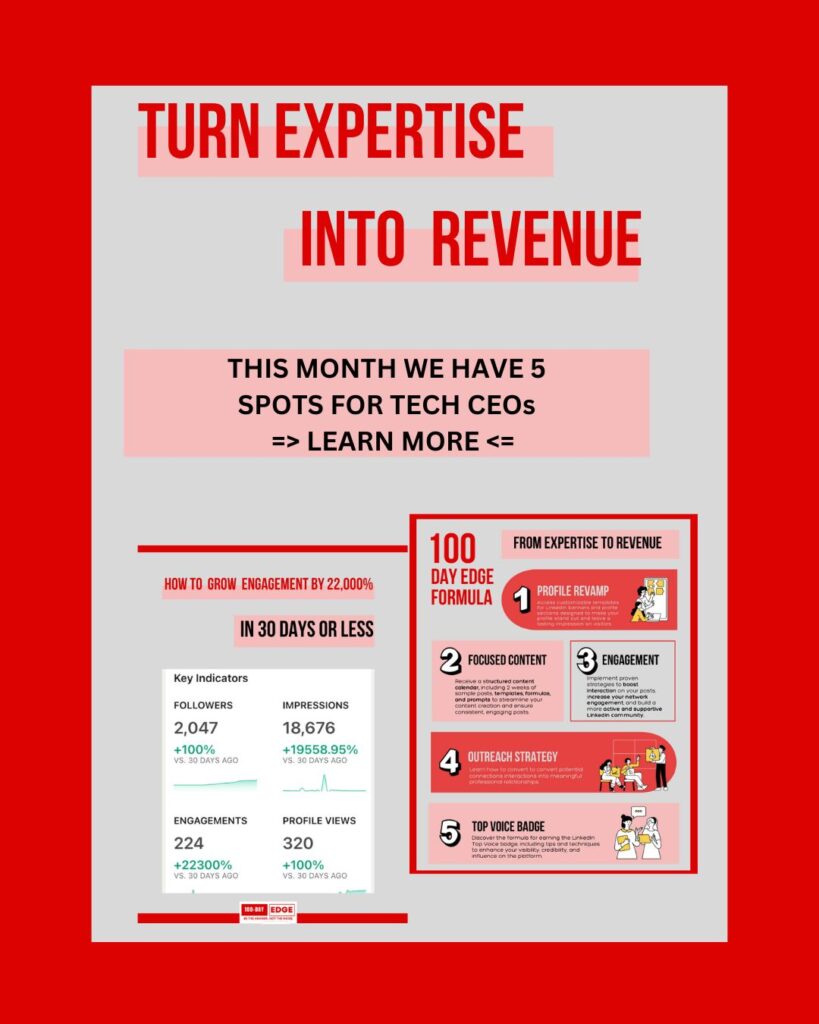
This month, my team is helping 5 technology leaders transform their expertise into tangible business results.
In 100 days, you’ll:
- Stage 1: Define your EDGE and optimize your online presence.
- Stage 2: Engage your tribe and land your first high-value client.
- Stage 3: Set your EDGE on fire with strategic content and recurring revenue.